最近因为折腾Magnum的关系,还是需要看一些go的代码,但是发现go语言虽好,但它的debug却仍然非常让人很不爽。不像Python, Go作为编译型语言,编译后是一个单独的二进制文件,不能像Python一样随时加入
import pdb
pdb.set_trace()
就可以加入断点。所以不得不花了点时间研究了一下,发现vscode通过安装devle 插件,还是实现在vscode里debug Go的代码的,不算是特别方便,但能用。
- 打开vscode的编辑器,选择左边的debug 菜单项后会出现如下图所示的debug界面
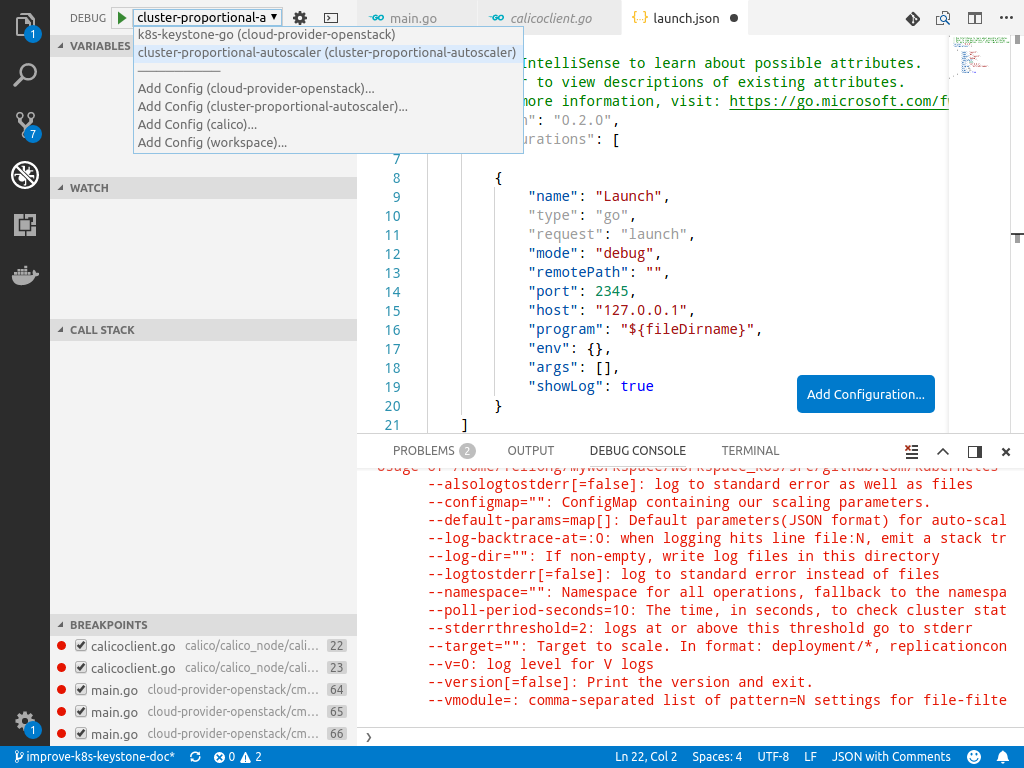
- 这时从左上角的下拉列表里就可以选择给你的某个项目加一个debug 配置文件,比如我们选择cloud-provider-openstack。默认情况下是生成一份空的配置文件,如下所示。
{
    // Use IntelliSense to learn about possible attributes.
    // Hover to view descriptions of existing attributes.
    // For more information, visit: https://go.microsoft.com/fwlink/?linkid=830387
    "version": "0.2.0",
    "configurations": [

        {
            "name": "Launch",
            "type": "go",
            "request": "launch",
            "mode": "debug",
            "remotePath": "",
            "port": 2345,
            "host": "127.0.0.1",
            "program": "${fileDirname}",
            "env": {},
            "args": [],
            "showLog": true
        }
    ]
}
3. 我们需要对它做一个简单的修改,变成这样。这里要修改的地方主要有,name, program, 和args, 当然如果你的程序不支持或者不需要args,那么完全可以忽略。
{
    // Use IntelliSense to learn about possible attributes.
    // Hover to view descriptions of existing attributes.
    // For more information, visit: https://go.microsoft.com/fwlink/?linkid=830387
    "version": "0.2.0",
    "configurations": [

        {
            "name": "k8s-keystone-go",
            "type": "go",
            "request": "launch",
            "mode": "debug",
            "remotePath": "",
            "port": 2345,
            "host": "127.0.0.1",
            "program": "${workspaceFolder}/cmd/k8s-keystone-auth/main.go",
            "env": {},
            "args": ["--keystone-url=http://192.168.122.1/identity/v3/",
                     "--tls-cert-file=/etc/kubernetes/certs/server.crt",
                     "--tls-private-key-file=/etc/kubernetes/certs/server.key",
                     "--keystone-policy-file=/etc/kubernetes/keystone_webhook_policy.json",
                     "-v=6"],
            "showLog": true
        }
    ]
}
4. 最后一步就是加断点了,和其他编辑器类似,直接点击左边的边框就可以给当前行加断点。然后直接按F5或者通过菜单执行debug就可以了,具体见下图。
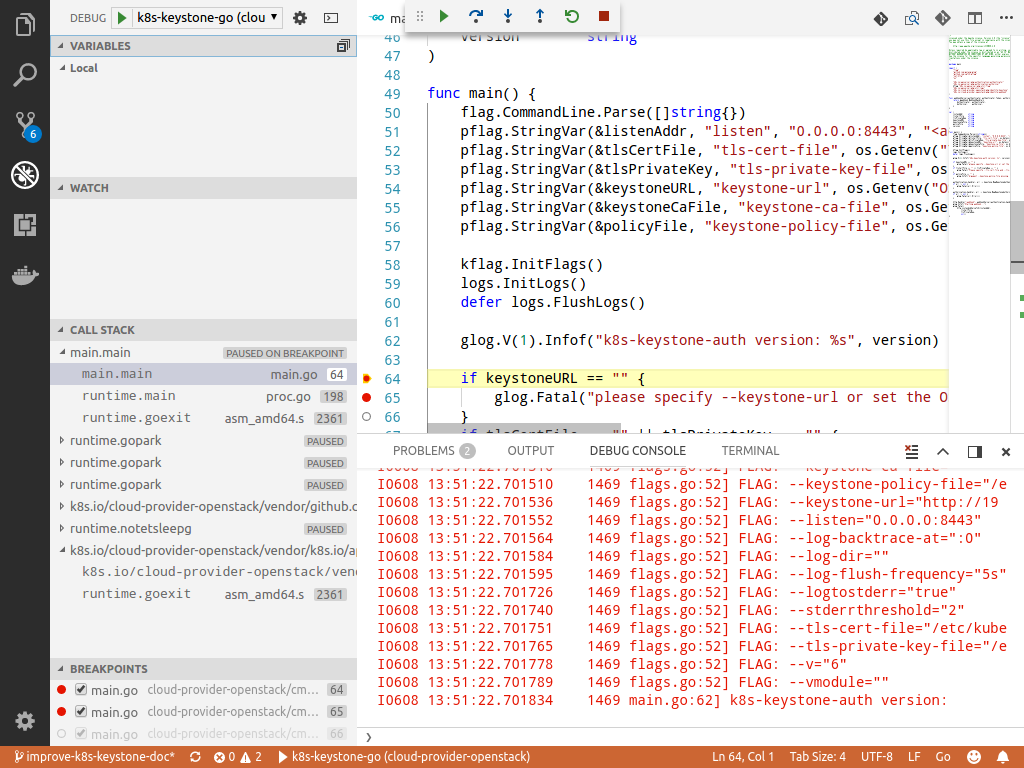
更多详细的配置,请参考下面两个链接,enjoy your go journey!
[1] https://github.com/Microsoft/vscode-go/wiki/Debugging-Go-code-using-VS-Code [2] https://code.visualstudio.com/docs/editor/debugging#_launch-configurations